ZandoupZandoup

Why Zandoup

Data-driven restaurant operations without the spreadsheet chaos

Zandoup turns your daily operations into practical data: sales trends, product performance, payments, inventory, staff activity, and customer behavior.

4

report families

Live

KPIs

Better

decisions

Analytics dashboard and restaurant reports
Analytics dashboard and restaurant reports 1
Analytics dashboard and restaurant reports 2

Zandoup insight

Turn every order into a better decision

Operational outcomes

Turn every order into a better decision

Analytics dashboard and restaurant reports
01

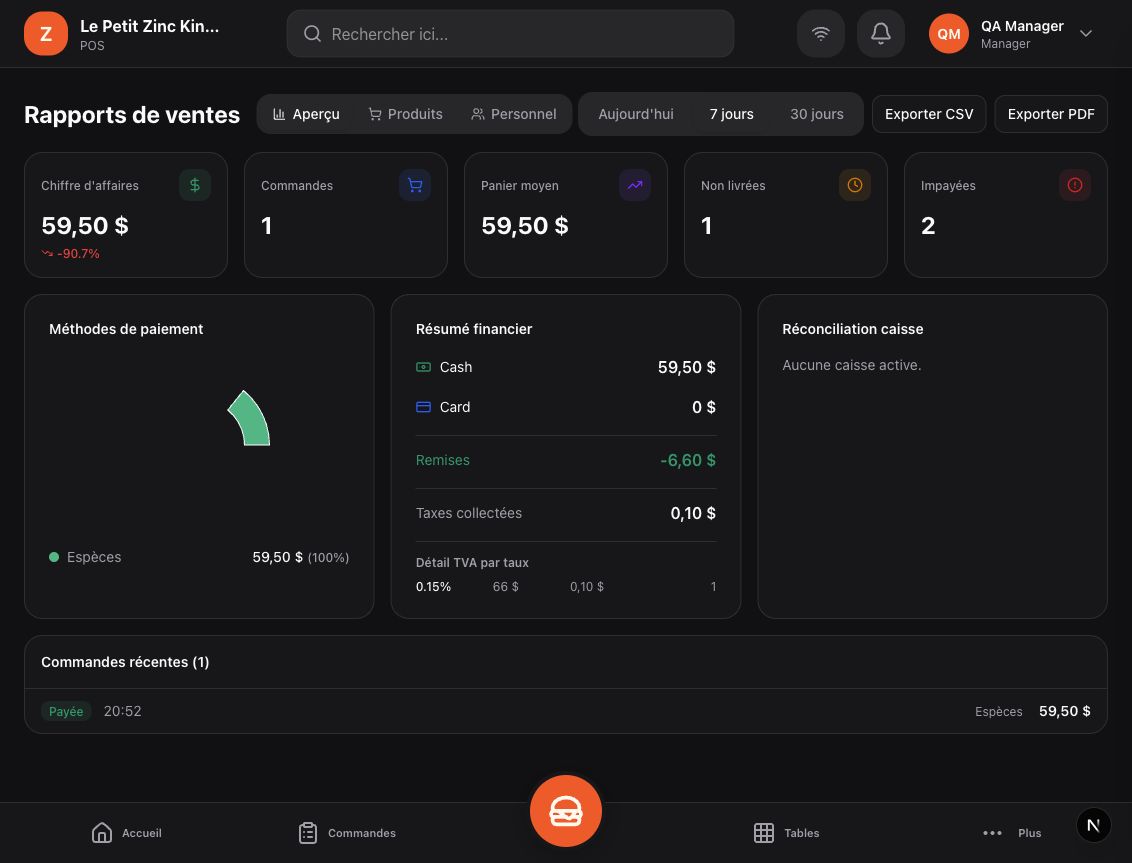
A dashboard owners can actually use

Instead of exporting spreadsheets from disconnected tools, Zandoup keeps operational signals in one place so the next decision is easier to make.

  • Live sales and order KPIs
  • Payment, product, and staff report views
  • Export-ready data for review and planning
02

Spot what changes margins

Menu profitability depends on price, ingredient cost, stock movement, and service volume. Zandoup helps connect those signals.

  • Top and low-performing products
  • Inventory and recipe visibility
  • Sales trends by period and location
03

Turn customer behavior into action

Customer history, order frequency, and segments help you build offers that bring people back without guessing.

  • Customer profiles and order history
  • Segments for campaigns and loyalty
  • Insights for WhatsApp follow-ups and promotions

Why it works

Made for teams that serve, sell, and manage in real time.

Sales intelligence

See revenue, order volume, top products, and service performance.

Product insights

Know what sells, what slows down, and what needs menu attention.

Staff reporting

Understand team activity, shifts, and performance across registers and locations.

Multi-location visibility

Compare locations and make decisions from a single owner view.